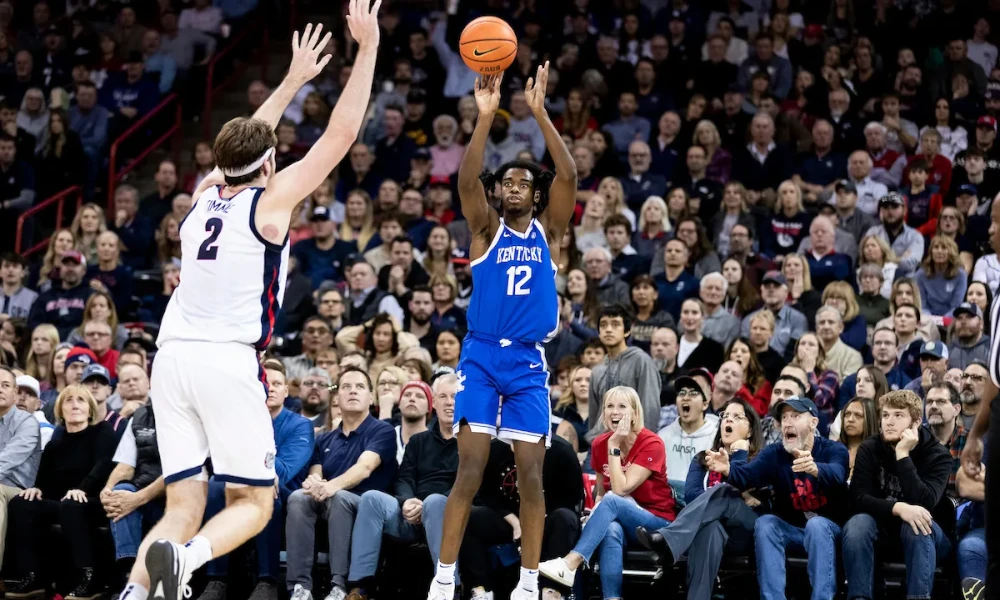
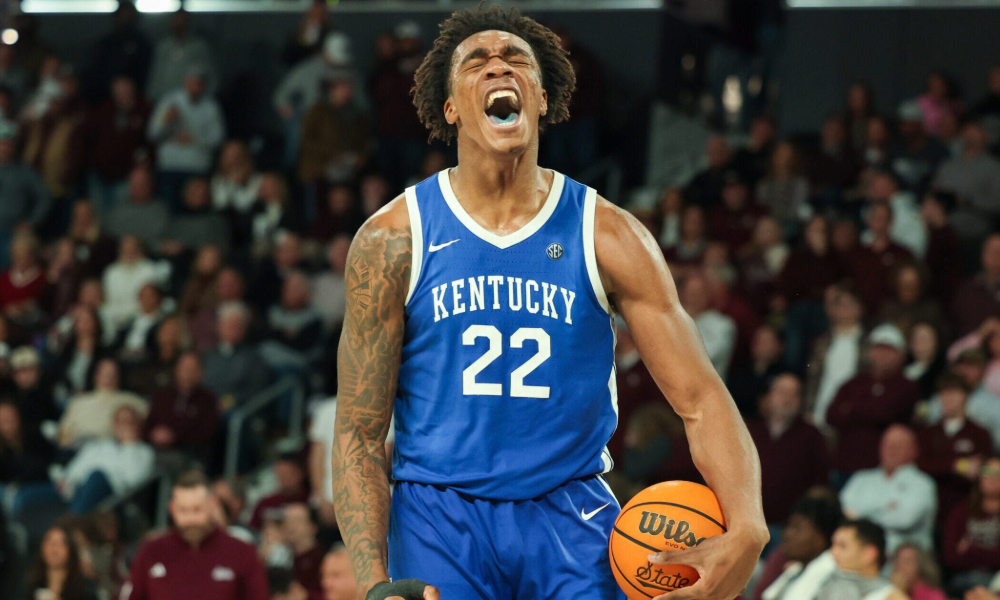
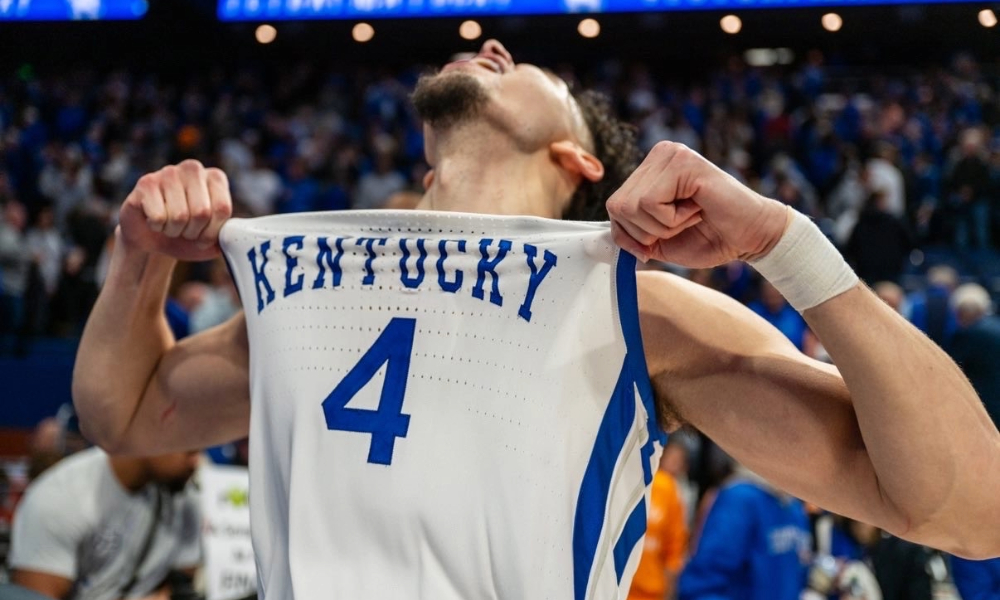
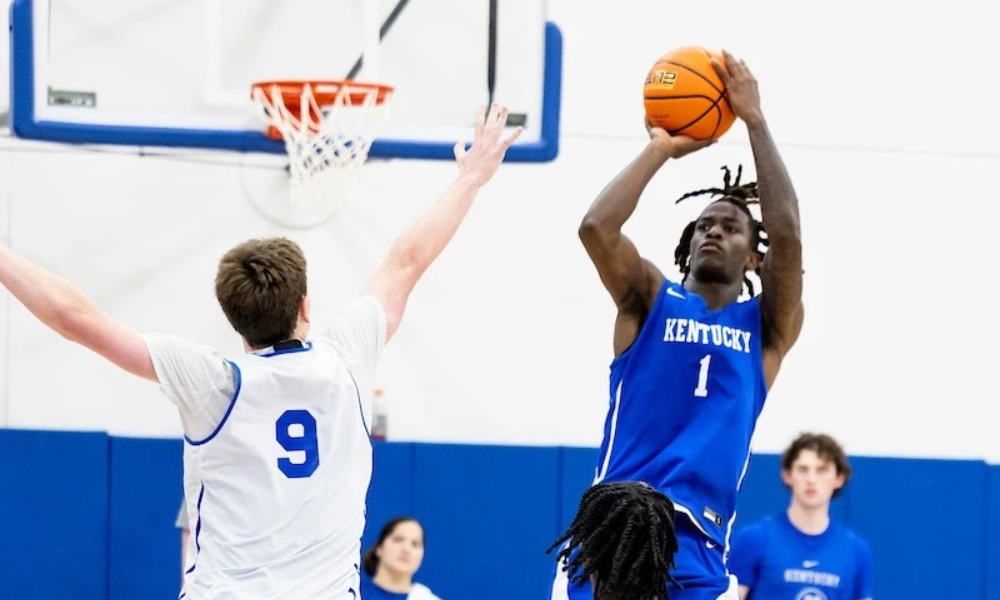
The Kentucky Wildcats have looked dominant against inferior competition. In three games against sub-100 KenPom teams, the Wildcats have averaged 92.7 points on 52.9 percent shooting from the field and 47.8 percent from three, while only giving up 59.3 points per game.
However, against their two ranked opponents, Kentucky has looked vastly different on both ends of the floor. In those games, the Wildcats have averaged 74.5 points per contest on 39.6 percent shooting from the field and 26 percent from three, while giving up 82.5 points per game.
Struggling to find their early season footing, John Calipari is still experimenting with lineups and has cited injuries and a lack of practice time as reasons for this.
With that being said, let’s take a look at what lineups did and did not work against Gonzaga, as well as the shot selection.
Offensive Lineups
Following the Gonzaga game, there was one fan that compared the Kentucky offense to a “chicken running around with its head cut off”. At times it certainly looked like that.
Just take a look at the first offensive possession of the game. After getting the tip, the Wildcats forced a busted play and shot a contested three at the end of the shot clock.
This obviously is not the offense that Calipari wants. After the game, Calipari said that this specific play was one they had gone over in the huddle just seconds before tipoff and that he was “embarrassed” at the lack of execution.
So which lineups executed the best?
- Wheeler-Wallace-Fredrick-Toppin-Tshiebwe: 20 possessions played, 31.6% FG, 14.3% 3P, .7 points per possession, Zero TOs,
- Wallace-Fredrick-Reeves-Toppin-Tshiebwe: 20 possessions played, 56.3% FG, 60% 3P, 1.05 points per possession, 4 TOs,
- Wallace-Fredrick-Reeves-Toppin-Ware: 12 possessions played, 18.2% FG, 0% 3P, .5 points per possession, TOs, Zero TOs
- Reeves-Fredrick-Livingston-Toppin-Tshiebwe: 8 possessions played, 25% FG, 0% 3P, .5 points per possession, 2 TOs,
Unsurprisingly, the best lineup in terms of production featured Wallace-Fredrick-Reeves-Toppin-Tshiebwe, five players that are a threat to score in a variety of ways. This lineup was the only Kentucky lineup that average more than 1 point per possession.
The other most played lineup was similar but included Wheeler instead of Reeves. This isn’t to say that this lineup did not do good things, as there were no turnovers and the second-most points per possession. However, Gonzaga was able to sag off Wheeler, and could put more effort into guarding Fredrick and Tshiebwe in that lineup.
Proving himself as one of the best ball distributors in the country in back-to-back seasons, Wheeler deserves to play, but Calipari needs to scheme around his weaknesses, which he suggested he is doing on Monday’s call-in show.
Defensive Lineups
With the size and length of this roster, this year’s Kentucky Wildcats has the chance to be one of the best defensive teams of the Calipari era. However, they are from that at the moment.
Against Gonzaga, Kentucky rarely forced the Bulldogs into difficult shots. In fact, of their 88 points, they scored 44 of them in the paint.
With that said, Kentucky did have some lineups that were effective, but at the cost of offense. With the two aforementioned lineups above, Gonzaga forced the ball over, but still averaged more than 1 point per possession and shot well over 50 percent from the field.
- Wallace-Fredrick-Reeves-Toppin-Tshiebwe: 20 possessions played, 58.3% FG, 1.2 points per possession, 4 forced TOs
- Wheeler-Wallace-Fredrick-Toppin-Tshiebwe: 18 possessions played, 70% FG, 1.056 points per possession, 7 forced TOs
- Wallace-Fredrick-Reeves-Toppin-Ware: 12 possessions played, 37.5% FG, .667 points per possession, 8 forced TOs
- Reeves-Fredrick-Livingston-Toppin-Tshiebwe: 6 possessions played, 25% FG, .667 points per possession, 4 forced TOs
The two lineups that were effective included Ware and Livingston, and the one common denominator they bring is toughness.
Ware can be played in spurts, but has shown that he exceeds primarily on offense in pick-and-roll situations. Whereas Livingston is just a freshman and still has room to grow his offensive game, but hasn’t gotten the game time to do so.
Also, as the season goes along and he develops, don’t be surprised to see Ugonna Onyenso in some situations due to his elite shot-blocking ability.
Shot Selection
The shot chart on the left is against South Carolina State, just days before the matchup with Gonzaga, which shot chart is on the right.
What is the difference?
On the left, is the ideal modern offensive shot chart, showing strictly threes and shots inside the paint. In that game, Kentucky scored 80 of their 106 points in the paint or from three, showing that they played efficiently.
Whereas, on the right, shots are scattered across the county including plenty of mid-range shots. This shows just how much duress the offense was in.
Obviously, there is a different level of defense that the Wildcats are playing in each of the shot charts. With that said, ineffective lineups and lack of execution amplify the problems.
Related


 Men's Basketball1 week ago
 Men's Basketball2 weeks ago
 Men's Basketball3 days ago
 Men's Basketball1 week ago
 BB Recruiting1 week ago
 Men's Basketball1 week ago
 Men's Basketball1 day ago
 Men's Basketball2 weeks ago


